Case study · Full stack
Trading terminal with AI signals
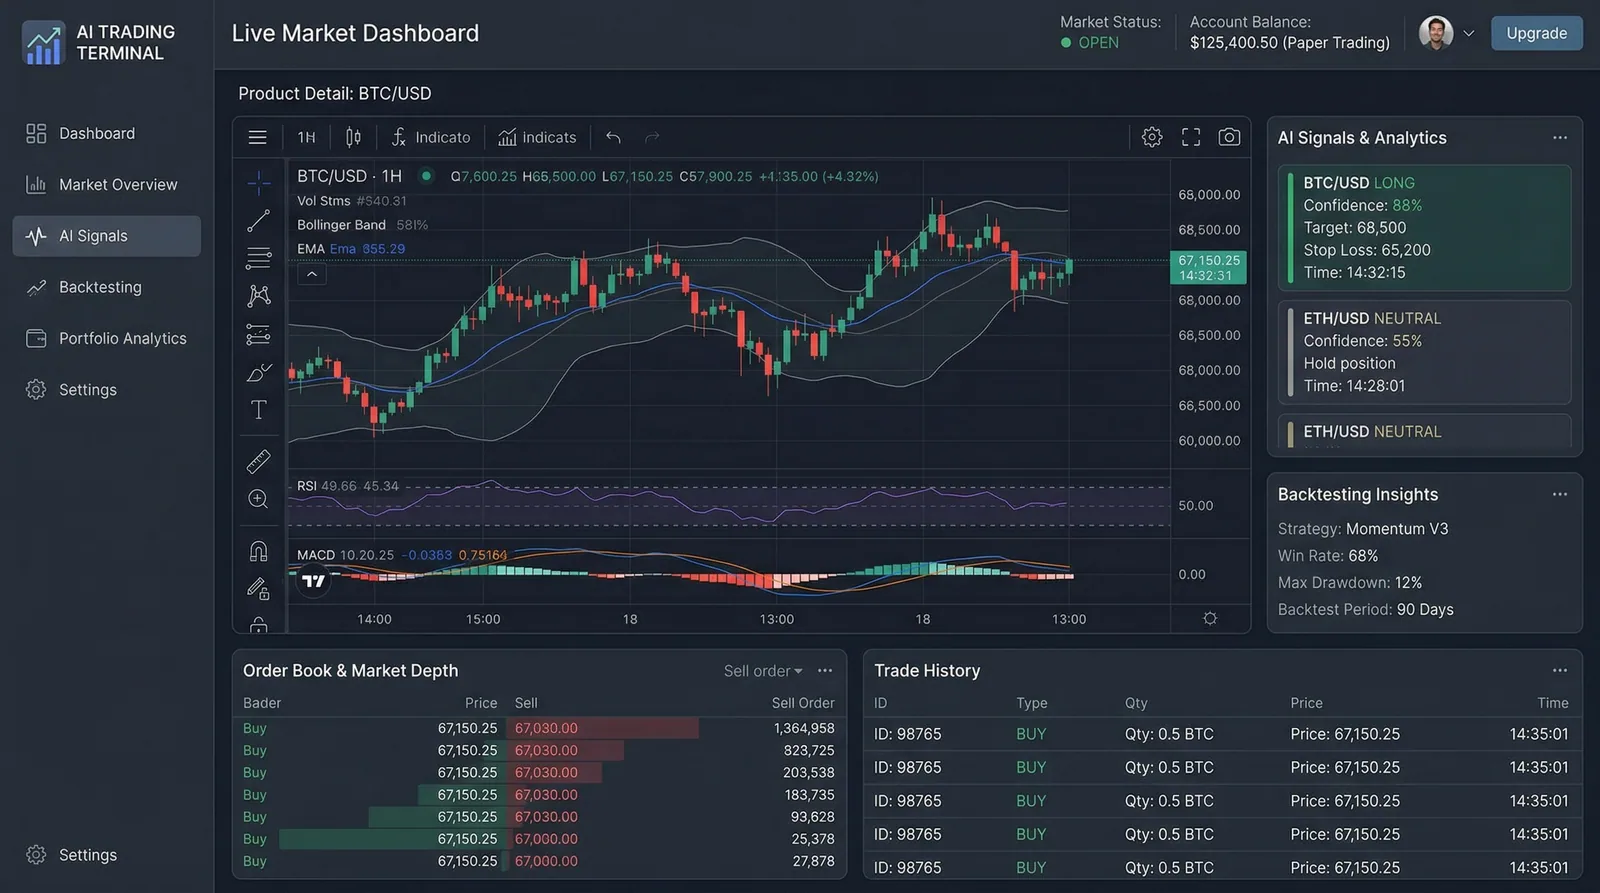
A dashboard for SPY and TSLA with one-minute candles, more than 25 technical indicators, buy and sell signals from a language model, paper trading and portfolio analytics.
- Year
- 2024
- Duration
- 4 months
- Type
- Full stack
- Status
- In production
Results
- Charts update every 15 seconds
- Sharpe ratio above 1.8 in backtests
- Paper trading built in
The problem
Professional trading terminals cost $24k+ a year, which rules out most retail traders, small desks and fintech startups. Open-source charting tools show price data but offer no AI analysis, backtesting or portfolio optimization.
What we built
We built a trading dashboard with live 1-minute candles (updated every 15 seconds), 25+ technical indicators and buy/sell signals from Claude that weigh price action against macro data. A paper trading engine models fills with slippage and commissions, and the backtester reports Sharpe ratios under realistic market conditions.
- Live market data
- WebSockets stream SPY and TSLA 1-minute candles every 15 seconds, along with order book depth and trade history. Recharts v3 draws each update in under a frame.
- AI trade signals
- Claude 3.5 Sonnet reads price, RSI, MACD, VIX and yield curves together and returns signals such as "Strong buy: RSI 28 + MACD crossover + VIX spike", each with a confidence score.
- Paper trading
- A $100k virtual portfolio with realistic fills, slippage and commissions. Position sizes are suggested from the Kelly criterion and portfolio correlation.
- Backtesting
- Backtrader runs strategies on historical data with realistic fill assumptions and reports Sharpe ratio, max drawdown, win rate and the equity curve.
- 25+ technical indicators
- RSI, MACD, Bollinger Bands, EMA, SMA, ATR, OBV, Stochastic, Ichimoku Cloud and more. Each one is configurable and drawn on the interactive chart.
How it works
Streaming market data with an AI analysis layer and a paper trading simulator on top.
- 01
Data ingestion
yfinance + AlphaVantage + FRED APIs → Redis Streams (market data buffer)
- 02
Processing
TA-Lib computes 25+ indicators → FastAPI combines them across timeframes
- 03
AI analysis
Claude 3.5 Sonnet reads price, indicators and macro context → signals with confidence scores
- 04
Delivery
WebSocket push to the Next.js frontend → Recharts draws live candles and signal overlays
- 05
Simulation
Paper trades fill against live data → portfolio tracker updates P&L, Sharpe and drawdown
Screens
Decisions
- FastAPI + WebSocketsBackend
- Native async WebSockets and generated OpenAPI docs made FastAPI a better fit than Express. Redis Streams buffer bursts of market data, so no updates are dropped when volatility spikes.
- Recharts v3Frontend
- We picked it over Lightweight Charts because it renders as React components and is easy to customize. Canvas rendering keeps 10k+ data points at 60fps, which smooth 1-minute candles need.
- Claude 3.5 SonnetAI / ML
- Its analysis was more conservative and better reasoned than GPT-4o's. GPT-4o tended toward overconfident signals, while Claude hedged in a way that fits how uncertain markets are.
- Redis StreamsInfrastructure
- At our throughput, under 10k messages/sec, Kafka was not worth its operational overhead. Redis Streams gave us reliable at-least-once delivery with 80% less infrastructure.
What went wrong
Chart jank during live updates
- Problem
- With 10k+ candles and indicator overlays on screen, React re-renders took 200ms+. The chart visibly stuttered on every 15-second update.
- Fix
- We moved rendering to a virtualized canvas layer and moved indicator calculations into Web Workers, off the main thread. Each tick appends data instead of replacing the whole array.
- Result
- Frame time fell from 200ms to 8ms. Charts hold 60fps with all 25 indicators visible.
Signals arriving too late
- Problem
- Claude takes 2-3 seconds to respond, which is too slow for a fast market. By the time a "buy" signal appeared, the price had often moved 0.3%+.
- Fix
- We had the model analyze incoming data continuously in the background and prepare signals in advance. When conditions match a precomputed scenario, the signal appears in under 200ms.
- Result
- For 70% of signals, latency fell from 2.8s to 180ms. The other 30% come from new market conditions and still take 1.8s, with a "Computing..." indicator.
Team and stack
Hiroshi built the charting frontend and the paper trading engine. Kenta built the FastAPI WebSocket service and the Claude signal engine. Hiroki built the market data pipeline on Redis Streams and the indicator calculations.
- Next.js 15
- FastAPI
- WebSockets
- Redis
- Claude 3.5 Sonnet
- Recharts
- TA-Lib
- Clerk